Canada Revenue Agency Quarterly Financial Report For the quarter ended December 31, 2022
Disclaimer
We do not guarantee the accuracy of this copy of the CRA website.
Scraped Page Content
Canada Revenue Agency Quarterly Financial Report For the quarter ended December 31, 2022
Statement outlining results, risks and significant changes in operations, personnel and program
Introduction
This quarterly financial report has been prepared by management as required by section 65.1 of the Financial Administration Act in the form and manner prescribed by the Treasury Board. This report should be read in conjunction with the Main Estimates.
Further details on the Canada Revenue Agency's (CRA) program activities can be found in the Departmental Plan.
Basis of Presentation
This quarterly report has been prepared by management using an expenditure basis of accounting. The accompanying Statement of Authorities includes the CRA's spending authorities granted by Parliament and those used by the CRA consistent with the Main Estimates for the 2022-2023 fiscal year. This quarterly report has been prepared using a special purpose financial reporting framework designed to meet financial information needs with respect to the use of spending authorities.
The authority of Parliament is required before moneys can be spent by the government. Approvals are given in the form of annually approved limits through appropriation acts or through legislation of statutory spending authority for specific purposes.
The CRA uses the full accrual method of accounting to prepare and present its annual departmental financial statements that are part of the departmental performance reporting process. However, the spending authorities voted by Parliament remain on an expenditure basis.
This quarterly report has not been subject to an external audit or review.
Highlights of the fiscal year-to-date (YTD) results
Figure 1 below reflects the CRA's annual net authorities available for use, as well as the CRA’s YTD expenditures as at December 31, 2022.
The CRA's annual net authorities and YTD expenditures have increased primarily due to the Climate Action Incentive (CAI). Further analysis of authorities and expenditures are below.

This graphic provides a two-year comparison of the Agency’s annual authorities available for use as of December 31 against first quarter expenditures for 2022-2023 and 2021-2022. In 2022-2023, the Agency’s annual authorities available for use were $13,526M, while third quarter expenditures were $9,259M. In comparison, 2021-2022 annual authorities available for use were $11,633M, while year-to-date quarter expenditures were $7,702M. This graphic also shows the portion of authorities and expenditures related to Climate Action Incentive (CAI) payments. In 2022-23, $7,088M of the annual authorities, and $4,864M of year-to-date expenditures were related to CAI payments. Comparatively, in 2021-22, $5,856M of the annual authorities, and $3,658M of year-to-date expenditures were related to CAI payments
- Figure 1 – details
Figure 1: Annual authorities against YTD expenditures as at December 31, 2022
Year Authority/Expenditure Total Authorities Excluding Climate Action Incentive Climate Action Incentive payments Total 2021-2022 Authorities $ 5 777 474 $ 5 856 000 $ 11 633 474 2022-2023 Authorities $ 6 437 500 $ 7 088 000 $ 13 525 500 2021-2022 YTD Expenditures $ 4 044 054 $ 3 658 329 $ 7 702 383 2022-2023 YTD Expenditures $ 4 394 628 $ 4 864 360 $ 9 258 988
Analysis of Authorities
This report reflects the results for the current fiscal year in relation to the Main Estimates, authorities available for use from the prior fiscal year and Supplementary Estimates B.
As shown in the restated table below, the CRA's total Budgetary Authorities have increased by $1,892 million since the third quarter of 2021-2022, from $11,634 million in 2021-2022, to $13,526 million in 2022-2023.
| (in thousands of dollars) | Total available for use for the year ending March 31, 2023 | Total available for use for the year ending March 31, 2022 | Variance in budgetary authorities |
|---|---|---|---|
| Gross Vote 1 – Operating Expenditures | 5,426,158 | 4,903,354 | 522,804 |
| Revenue Credited to the Vote | (440,567) | (432,685) | (7,882) |
| Vote 5 – Capital Expenditures | 114,518 | 89,892 | 24,626 |
| Subtotal - Voted Authorities | 5,100,109 | 4,560,561 | 539,548 |
| Budgetary Statutory Authorities | 8,425,391 | 7,072,914 | 1,352,477 |
| Total Budgetary Authorities | 13,525,500 | 11,633,474 | 1,892,026 |
- This table is an extract of Appendix 1 of this report. Columns and rows may not add exactly due to rounding.
- 2021-2022 authorities include the Main Estimates, authorities available for use from the prior fiscal year and Supplementary Estimates A. 2022-2023 authorities include the Main Estimates, authorities available for use from the prior fiscal year and Supplementary Estimates B.
The Vote 1 Gross Operating Expenditures Authority increased by $523 million, from $4,903 million in 2021-2022 to $5,426 million in 2022-2023.
The items that have a material impact on the Vote 1 Gross Operating Expenditure Authority include:
- $322 million increase in authorities for Budget 2021 measures;
- $195 million increase in authorities available for use from the prior fiscal year;
- $87 million decrease in authorities related to previous federal budget measures;
- $74 million increase in authorities for Budget 2022 measures;
- $24 million increase in authorities due to a smaller vote realignment from Vote 1 to Vote 5 for the Strategic Investment Plan (SIP) and to address capital requirements for information technology (IT) work undertaken for the administration of COVID-19 measures; and
- $6 million decrease in authorities related to COVID-19 measures.
The Revenue Credited to the Vote is for the CRA's administrative responsibilities to support the Canada Pension Plan (CPP) and Employment Insurance (EI) program. In 2022-2023, the CRA's commitment is $441 million compared to $432 million in 2021-2022, an increase of $8 million, due the annual volume adjustment.
The Vote 5 Capital Expenditures Authority increased by $25 million, from $90 million in 2021-2022 to $115 million in 2022-2023. This increase is due to:
- $31 million increase in authorities available for use from the prior fiscal year;
- $24 million decrease in authorities due to a smaller vote realignment from Vote 1 to Vote 5 for the SIP and to address capital requirements for IT work undertaken for the administration of COVID-19 measures;
- $19 million increase in authorities related to the Budget 2021 initiatives;
- $6 million increase in authorities related to the Budget 2022 initiatives;
- $4 million decrease in authorities for the Canada Emergency Wage Subsidy; and
- $3 million decrease in authorities related to the Budget 2019 initiatives.
Total Budgetary Statutory Authorities increased by $1,352 million, from $7,073 million in 2021-2022 to $8,425 million in 2022-2023. The majority of the increase in authorities is attributable to the following:
- $1,232 million increase in the estimate of fuel charge proceeds to be returned to families and individuals through quarterly CAI payments. This increase is due to an updated forecast provided by the Department of Finance which reflects the increase in the prices on carbon pollution under the federal carbon pollution pricing system;
- $106 million in increased spending of revenues received primarily attributable to the Canada Recovery Benefit, Canada Recovery Caregiving Benefit and Canada Recovery Sickness Benefit initiatives;
- $28 million increase in Employee Benefit Plan (EBP) contributions due to increased contributions associated with Budget 2022 initiatives;
- $8 million in decreased forecasted payments under the Children's Special Allowances Act as the 2021-2022 forecast included COVID-19 Canada Child Benefit Boost supplemental payment amounts; and
- $6 million in decreased forecasted payments for the Distribution of Fuel and Excess Emission Charges to reflect the updated forecast provided by the Department of Finance.
Analysis of Expenditures
2.1 Expenditures by Authority
The YTD expenditures as at December 31, 2022 have increased by $1,557 million, as displayed in the Statement of Authorities. The material components of these year-over-year changes are presented below.
As the explanations for the year-over-year third quarter variances are often similar to the YTD variances, only the YTD variances are explained in detail.
| (in thousands of dollars) | YTD expenditures at December 31, 2022 | YTD expenditures at December 31, 2021 | Variance in YTD expenditures |
|---|---|---|---|
| Net Vote 1 – Operating Expenditures | 3,339,905 | 3,143,074 | 196,831 |
| Vote 5 – Capital Expenditures | 51,056 | 49,814 | 1,242 |
| Subtotal – Voted Expenditures | 3,390,961 | 3,192,888 | 198,074 |
| Budgetary Statutory Authorities | 5,868,027 | 4,509,495 | 1,358,532 |
| Total Budgetary Authorities | 9,258,988 | 7,702,383 | 1,556,605 |
- This table is an extract of Appendix 1 of this report. Columns and rows may not add exactly due to rounding.
The CRA's YTD Net Vote 1 Operating Expenditures have increased by $197 million, or 6%. The $197 million increase is composed of a $193 million increase in salary expenditures and a $4 million increase in operations and maintenance (O&M) expenditures. The items that have a material impact on the increase in salary and O&M expenditures include:
Salary expenditures

$139 million increase related to the implementation and administration of Budget 2021 and Budget 2022 measures;
$34 million increase related to spending on CRA contact centres responding to high call volumes;
$31 million increase related to the CRA's collective bargaining agreements; and
Offset by an $11 million decrease in spending on various prior year federal budget initiatives.
O&M expenditures
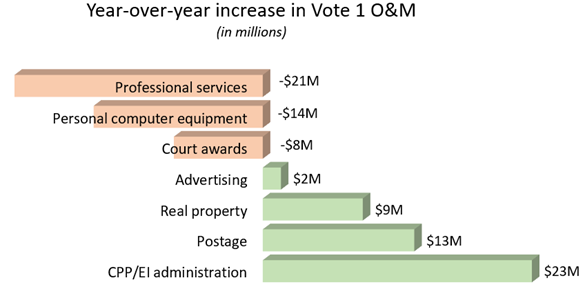
$21 million decrease in professional services including services from Shared Services Canada (SSC), offset by an increase in Department of Justice expenditures;
$14 million decrease in spending on personal computer equipment. In 2021-2022, the CRA purchased additional hardware inventory amid the global shortage of electronics. Therefore, in 2022-2023, spending has decreased as the inventory purchased in the prior year is being used to fulfill hardware requirements;
- $8 million decrease in court awards paid primarily attributable to one court award paid in Q1 of 2021-2022;
- $2 million increase in advertising costs related to the use of television contracts for the Benefits and Credits campaign;
- $9 million increase in real property expenditures related to additional workload to accelerate workplace modernization and increases in construction costs due to inflation and supply chain issues;
- $13 million increase in postage due to the change of the CAI to a quarterly benefit model, the one-time Goods and Services Tax Credit (GSTC) top-up payment, and mail volumes returning to pre-pandemic levels; and
- $23 million increase related to differences in timing of posting of CPP and EI expenditures.
The CRA's YTD Vote 5 Capital Expenditures have increased by $1 million, or 2%, from $50 million in 2021-2022 to $51 million in 2022-2023. The increase is primarily tied to capital funding received this year for Budget 2022 initiatives.
The CRA's YTD Budgetary Statutory Authorities have increased by $1,359 million, or 30%, from $4,509 million in 2021-2022 to $5,868 million in 2022-2023. The majority of the increase in statutory authorities is attributable to the following:
- $1,206 million increase in CAI payments made to families and individuals due to higher benefit payment amounts in 2022-2023, which reflects the increase in the prices on carbon pollution, as well as the timing of payments; and
- $131 million increase due to differences in timing of recoveries for spending on activities administered on behalf of other government departments (OGDs), primarily related to the COVID-19 recovery benefits.
2.2 Expenditures by Standard Object
| (in thousands of dollars) | YTD expenditures at December 31, 2022 | YTD expenditures at December 31, 2021 | Variance in YTD expenditures |
|---|---|---|---|
| Personnel Expenditures | 3,673,719 | 3,338,642 | 335,077 |
| Transfer Payments | 5,170,106 | 3,971,299 | 1,198,807 |
| Other Standard Objects | 747,803 | 748,084 | (281) |
| Revenue Credited to the Vote | (332,639) | (355,642) | 23,003 |
| Total Budgetary Authorities | 9,258,988 | 7,702,383 | 1,556,605 |
Note: Transfer payments include the Children's Special Allowance payments, CAI payments, Distribution of Fuel and Excess Emission charges and the Energy Cost Benefit.
The personnel and transfer payments standard objects make up the majority of the year-over-year variance in YTD expenditures. In comparison, the remainder of the other standard objects have minimal year-over-year variances as illustrated in the table above.
The Departmental Budgetary Expenditures by Standard Object appendix table illustrates the increase in the CRA's year-to-date third quarter expenditures by standard object. The material components of the year-over-year change are presented below.
Personnel expenditures have increased by $335 million, or 10%, from $3,339 million in 2021-2022 to $3,674 million in 2022-2023. Please refer to the Vote 1 salary explanation for the variance explanation. The difference between the Vote 1 salary year-over-year variance and the personnel expenditures variance can be attributed to various items including EBP, respendable revenue and revenue credited to the vote.
Transfer payments have increased by $1,199 million, or 30%, from $3,971 million in 2021-2022 to $5,170 million in 2022-2023. The majority of this increase, $1,206 million, is related to CAI payments made to families and individuals. The increase is due to higher benefit payment amounts in 2022-2023, which reflects the increase in the prices on carbon pollution, as well as the timing of payments.
The other standard objects which make up the cumulative $0.3 million decrease are explained below:
Transportation and communications expenditures have increased by $15 million, or 30%, from $50 million in 2021-2022 to $65 million in 2022-2023. This increase is primarily due to the change of the CAI to a quarterly benefit model, the one-time GSTC top-up payment, and mail volumes continuing to return to pre-pandemic levels.
Information expenditures have increased by $2 million, or 17%, from $9 million in 2021-2022 to $11 million in 2022-2023. The majority of this increase is due to the use of television contracts for the Benefits and Credits campaign.
Professional and special services expenditures have decreased by $6 million, or 2%, from $369 million in 2021-2022 to $363 million in 2022-2023. The majority of this decrease is due to lower billing from SSC offset by an increase in Department of Justice expenditures and training costs.
Purchased repair and maintenance expenditures have increased by $9 million, or 22%, from $40 million in 2021-2022 to $49 million in 2022-2023. The majority of this increase is due to additional workload to accelerate workplace modernization and increases in construction costs due to inflation and supply chain issues.
Utilities, materials, and supplies expenditures have increased by $1 million, or 25%, from $6 million in 2021-2022 to $7 million in 2022-2023, primarily related to an increase in postage fees for various initiatives.
Acquisition of machinery and equipment expenditures have decreased by $16 million, or 33%, from $49 million in 2021-2022 to $33 million in 2022-2023. In 2021-2022, the CRA purchased additional hardware inventory amid the global shortage of electronics. Therefore, in 2022-2023, spending has decreased as the inventory purchased in the prior year is being used to fulfill hardware requirements.
Other subsidies and payments have decreased by $6 million, or 37%, from $15 million in 2021-2022 to $9 million in 2022-2023. Most of this decrease is attributable to a court award paid out in Q1 of 2021-2022.
Risks and uncertainties
The CRA dedicates significant effort to conduct regular environmental scans and update its Corporate Risk Profile (CRP) as the economic and technological landscape changes. The Board of Management monitors, and CRA senior management receives, quarterly updates on the CRP. As the CRA progresses through the phases of the transition plan to a hybrid working model and resumes more core compliance activities, it remains critical to manage and mitigate its key risks.
In terms of financial management, the timing of funding received for the implementation of federal budget initiatives and related commitments is a risk as well as the level of certainty regarding the CRA's authority levels given that a significant portion is based on costs recovered from OGDs. To mitigate these financial management risks, the CRA continuously and cautiously monitors its authority levels and expenditures throughout the year, conducts accurate and reliable forecasting of its operational spending, and has effective controls in place to ensure it does not go beyond its authorities.
Furthermore, almost all the risks listed in the Departmental Plan could have financial impacts should they materialize. Cybersecurity and the protection of information have shown a consistent upward trend in risk exposure for the past five years in most organizations. There is a risk that external cyber threats will leverage system vulnerabilities or business process flaws to compromise CRA IT systems, services, and/or taxpayer information. There is also an increased possibility for service interruptions due to cyber attacks on third-party service providers to the CRA. As more information and activities by individuals and organizations move online, there is an increased risk that the CRA will unintentionally release, lose, or compromise taxpayer information, or as an organization, be unable to protect information from an intentionally malicious person or group. To mitigate these risks, the CRA continually strengthens its overarching security program to ensure its cybersecurity and data protection posture keeps pace with the changing threat and work environment. The creation of the Security Branch recognizes the stronger posture needed for this program. With an increased level of resources, the Security Branch continues to identify and implement measures to reduce and proactively address potential risks, while responding swiftly to incidents and events. Additionally, the CRA's Chief Privacy Officer (CPO) continues to strengthen the CRA's Privacy Management Framework. The CPO plays a pivotal role in promoting Privacy by Design, including assessing the privacy impacts of the programs, managing privacy breaches, and championing personal privacy rights to ensure that Canadians' personal information is appropriately safeguarded and managed. Additional information regarding the CRA's key risk areas is presented in the 2022-2023 Departmental Plan.
Significant changes in relation to operations, personnel, and programs
As of December 1, 2022, the CRA has hired over 6,000 new employees over the past year to work on the administration of COVID-19 benefits as well as federal budget initiatives. A significant number of employees were hired in the contact centres, to maintain the service experience while also responding to inquiries about the COVID-19 recovery benefits as well as the new housing and dental benefits.
Approval by Senior Officials
Approved by:
[original signed by]
____________________________
Bob Hamilton, Commissioner
[original signed by]
___________________________
Hugo Pagé, Chief Financial Officer
Ottawa, Canada
Date:
| Total available for use for the year ending March 31, 2023table 4 note 1 |
Used during the quarter ended December 31, 2022 |
Year to date used at quarter-end | |
|---|---|---|---|
| Vote 1 -Operating expenditures | |||
| Gross Operating expenditures | 5,426,158 | 1,246,446 | 3,672,544 |
| Revenues netted against expenditures | (440,567) | (110,880) | (332,639) |
| Net Vote 1 -Operating expenditures | 4,985,591 | 1,135,566 | 3,339,905 |
| Vote 5 -Capital expenditures | 114,518 | 24,075 | 51,056 |
| Budgetary Statutory Authorities | |||
| Contributions to employee benefit plans | 568,300 | 132,996 | 398,989 |
| Children's Special Allowance payments (Children's Special Allowances Act) | 365,000 | 92,071 | 275,431 |
| Climate Action Incentive payments | 7,088,000 | 1,676,680 | 4,864,360 |
| Spending of revenues received through the conduct of its operations pursuant to section 60 of the Canada Revenue Agency Act | 384,998 | 96,691 | 294,886 |
| Distribution of Fuel and Excess Emission Charges | 19,000 | 12,291 | 30,317 |
| Minister's salary and motor car allowance | 93 | 23 | 69 |
| Collection Agency Fees under section 17.1 of the Financial Administration Act | - | - | - |
| Court awards -Supreme Court | - | - | 34 |
| Court awards -Tax Court of Canada | - | 2,314 | 3,869 |
| Spending proceeds from the disposal of surplus Crown Assets | - | 54 | 61 |
| Energy Cost Benefit | - | (1) | (3) |
| Refunds of previous years revenue | - | 3 | 14 |
| Total Budgetary Statutory Authorities | 8,425,391 | 2,013,123 | 5,868,027 |
| Total Budgetary Authorities | 13,525,500 | 3,172,764 | 9,258,988 |
Table 4 Notes
|
|||
| Total available for use for the year ending March 31, 2022table 5 note 1 |
Used during the quarter ended December 31, 2021 |
Year to date used at quarter-end | |
|---|---|---|---|
| Vote 1 - Operating expenditures | |||
| Gross Operating expenditures | 4,903,354 | 1,225,903 | 3,498,715 |
| Revenues netted against expenditures | (432,685) | (118,547) | (355,642) |
| Net Vote 1 - Operating expenditures | 4,470,669 | 1,107,355 | 3,143,074 |
| Vote 5 - Capital expenditures | 89,892 | 20,738 | 49,814 |
| Budgetary Statutory Authorities | |||
| Contributions to employee benefit plans | 539,500 | 121,202 | 363,607 |
| Children's Special Allowance payments (Children's Special Allowances Act) | 373,000 | 93,055 | 285,246 |
| Climate Action Incentive payments | 5,856,000 | 91,499 | 3,658,329 |
| Spending of revenues received through the conduct of its operations pursuant to section 60 of the Canada Revenue Agency Act | 279,323 | 55,350 | 163,883 |
| Distribution of Fuel and Excess Emission Charges | 25,000 | 24,621 | 27,726 |
| Minister's salary and motor car allowance | 91 | 23 | 68 |
| Collection Agency Fees under section 17.1 of the Financial Administration Act | - | 0 | 0 |
| Court awards - Supreme Court | - | 7 | 7 |
| Court awards - Tax Court of Canada | - | 272 | 10,587 |
| Spending proceeds from the disposal of surplus Crown Assets | - | 8 | 44 |
| Energy Cost Benefit | - | (1) | (2) |
| Refunds of previous years revenue | - | 1 | 1 |
| Total Budgetary Statutory Authorities | 7,072,914 | 386,037 | 4,509,495 |
| Total Budgetary Authorities | 11,633,474 | 1,514,130 | 7,702,383 |
Table 5 Notes
|
|||
| Planned expenditures for the year ending March 31, 2023 | Expended during the quarter ended December 31, 2022 |
Year to date used at quarter-end | |
|---|---|---|---|
| Expenditures: | |||
| Personnel | 4,704,789 | 1,245,719 | 3,673,719 |
| Transportation and communications | 275,694 | 19,788 | 65,027 |
| Information | 52,309 | 4,009 | 10,510 |
| Professional and special services | 938,279 | 131,867 | 363,022 |
| Rentals | 323,985 | 66,599 | 211,090 |
| Purchased repair and maintenance | 87,013 | 19,409 | 48,736 |
| Utilities, materials, and supplies | 46,123 | 2,355 | 6,984 |
| Acquisition of machinery and equipment | 60,668 | 8,802 | 33,068 |
| Transfer payments | 7,476,854 | 1,781,043 | 5,170,106 |
| Other subsidies and payments | 355 | 4,052 | 9,366 |
| Total Gross Budgetary Expenditures | 13,966,067 | 3,283,645 | 9,591,627 |
| Less: Revenues netted against expenditures | 440,567 | 110,880 | 332,639 |
| Total Net Budgetary Expenditures | 13,525,500 | 3,172,764 | 9,258,988 |
| Planned expenditures for the year ending March 31, 2022 | Expended during the quarter ended December 31, 2021 |
Year to date used at quarter-end | |
|---|---|---|---|
| Expenditures: | |||
| Personnel | 4,360,143 | 1,141,664 | 3,338,642 |
| Transportation and communications | 242,277 | 11,728 | 50,032 |
| Information | 35,374 | 4,138 | 8,950 |
| Professional and special services | 681,237 | 150,194 | 368,642 |
| Rentals | 303,960 | 68,807 | 210,685 |
| Purchased repair and maintenance | 61,906 | 13,603 | 39,842 |
| Utilities, materials, and supplies | 37,417 | 1,783 | 5,594 |
| Acquisition of machinery and equipment | 86,951 | 30,281 | 49,415 |
| Transfer payments | 6,256 693 | 209,174 | 3,971,299 |
| Other subsidies and payments | 200 | 1,305 | 14,924 |
| Total Gross Budgetary Expenditures | 12,066,159 | 1,632,677 | 8,058,025 |
| Less: Revenues netted against expenditures | 432,685 | 118,547 | 355,642 |
| Total Net Budgetary Expenditures | 11,633,474 | 1,514,130 | 7,702,383 |
Page details
2023-02-28